Room for improvement: An analysis of the South Africa vs Scotland match
Analysing some clips and data to better understand the match.
In the heart-pounding kickoff to the 2023 Rugby World Cup, South Africa emerged as a dominant force to be reckoned with as they secured an impressive 18-3 victory over Scotland. The clash, which unfolded on the world's grandest rugby stage, showcased the sheer power, and accuracy of the Springboks. In this analysis, we delve into a pre-planned play, data, and the rush defence that defined South Africa's victory in their opening match of the tournament. As always, the data is powered by Oval Insights.
One from the training ground
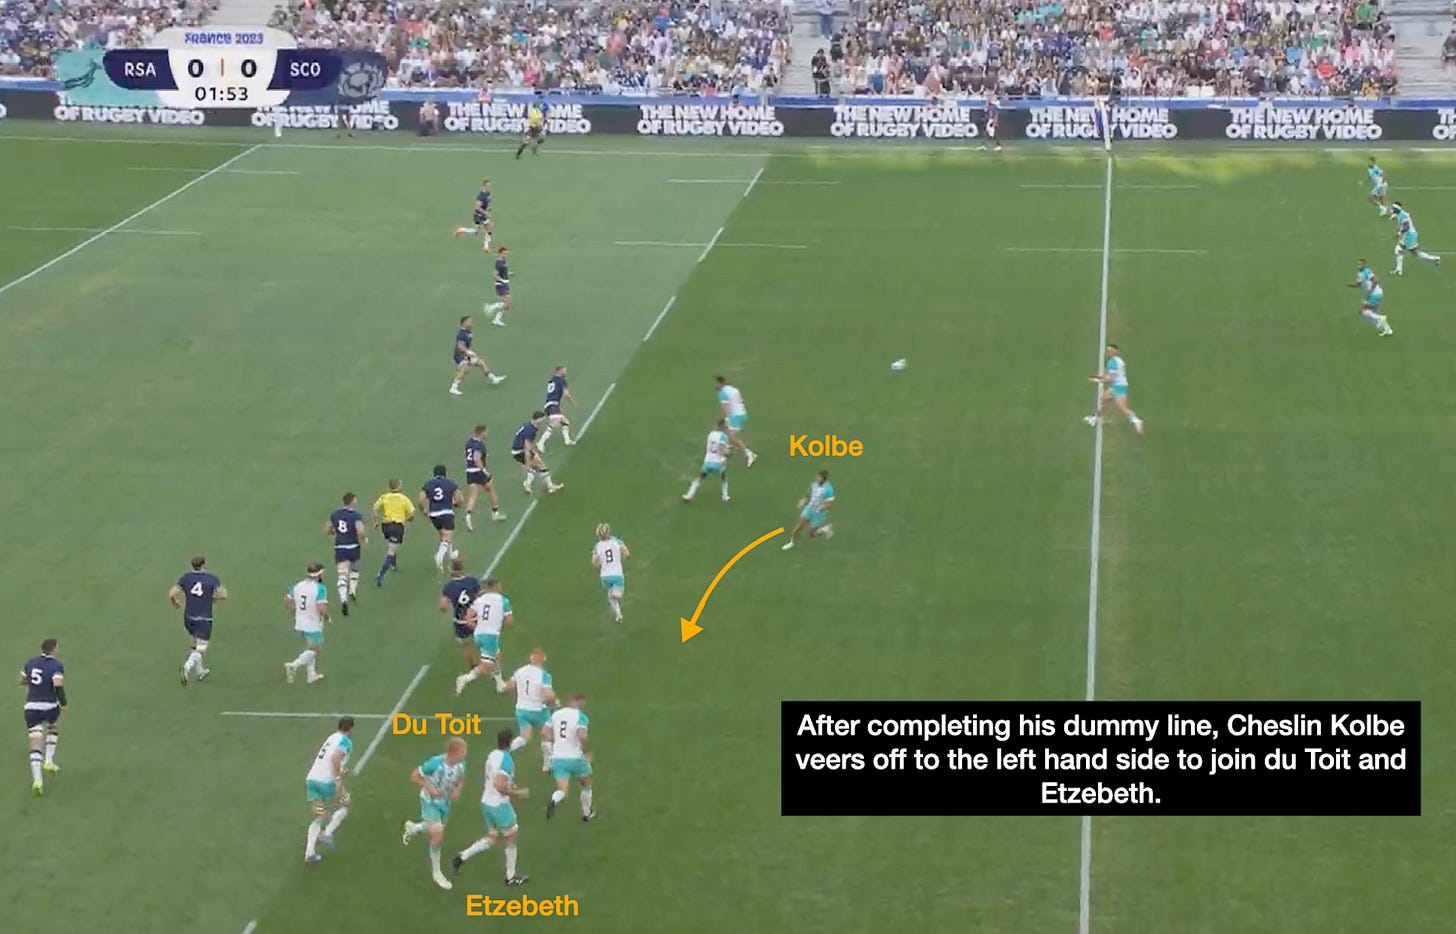
I thought it best to begin with some analysis into one of the first plays of the match:
The “Graham and White” vs “Kolbe, du Toit and Etzebeth” mismatch is something that the Boks had clearly planned for. Something we will likely see again in this tournament, should an opponent have a similar defence system off a lineout.
Ball carrying and gainline
Oval Insights data presents three key metrics related to the gainline:
Crossed Gainline
Negative Gainline
Neutral Gainline
To provide context for these figures, it is best to compare them to the number of carries made.
The Springboks made 98 carries, with 38 resulting in negative gainlines, yielding a negative gainline rate of 38.8%. This rate is higher (and therefore worse) than the negative gainline rate of 24.1% they achieved against New Zealand at Twickenham. However, despite this decrease in carrying effectiveness, South Africa forced Scotland into a negative gainline rate of 53.9%. The 76 Scottish carries resulting in 41 negative gainlines.
The statistics regarding metres gained tell a similar story, with South Africa doubling their opponents' metres, tallying 471 meters compared to Scotland's 225. Similarly, South Africa had 103 contact metres while Scotland had 54.
In terms of beating the defence, Scotland narrowly outperformed South Africa with 16 defenders beaten compared to the Boks' 15. However, South Africa managed to create twice as many clean breaks, totalling 6, as opposed to the Scots' 3.
Ruck speed
South Africa averaged 2.1 secs ruck speed in the opposition 22 and 2.0 seconds ruck speed in the opposition half to 22. Compared to the Scottish 3.2 secs and 2.6 secs respectively.
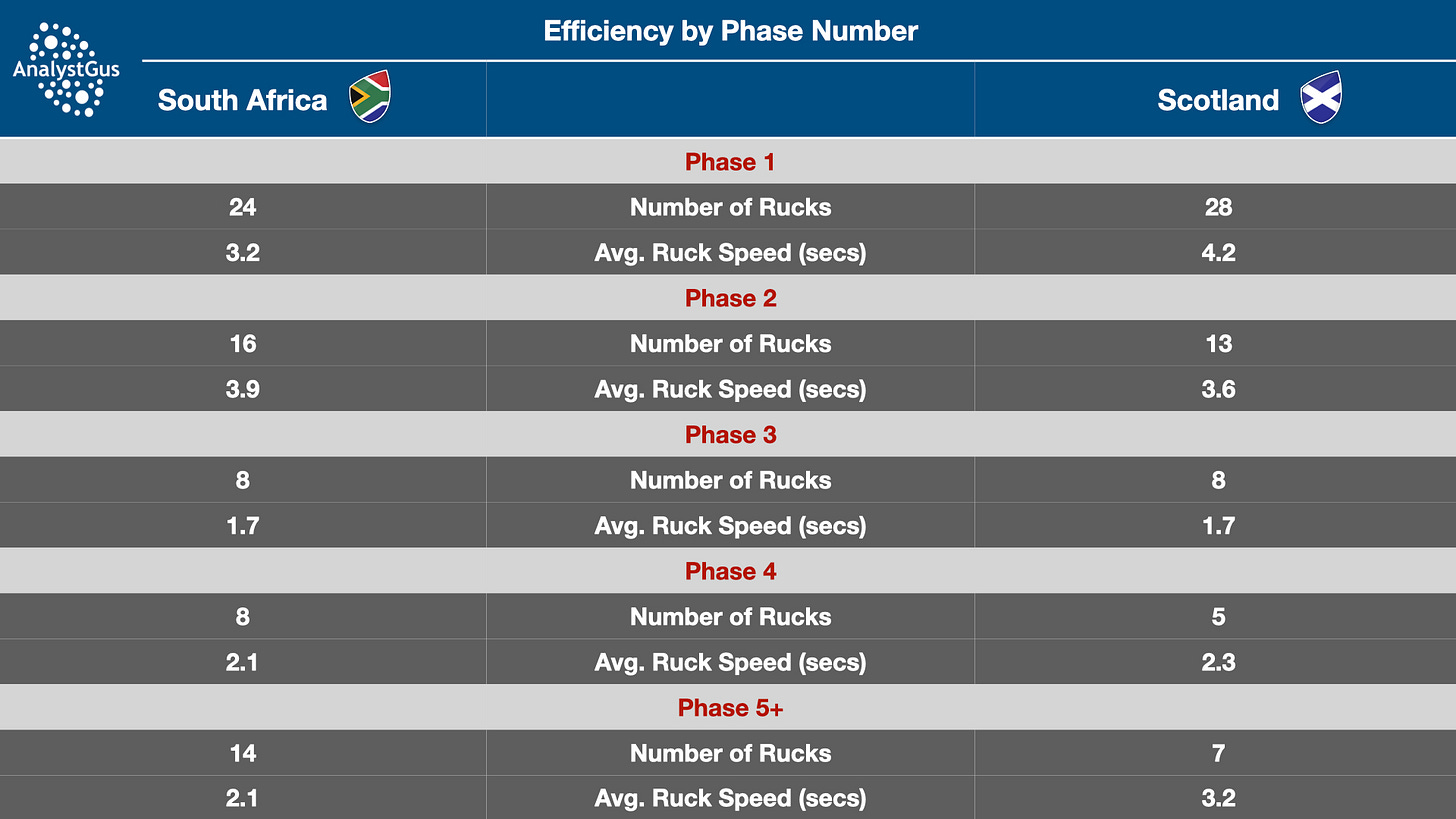
The Springboks also had a quicker average ruck speed in all phases but 2nd phase ball - with Scotland narrowly beating out the Boks with 3.6 secs. Most impressively for the Boks was the “Phase 5+” ruck speed of 2.1 secs. Which as mentioned above is the same speed as they averaged in the opposition 22. This makes sense as it is also the only area of the pitch the Boks are likely to play multiple phases.
Set-piece
In the first half, Scotland exerted significant pressure during scrum-time, particularly targeting Malherbe and Kitshoff. Nevertheless, over the course of the entire match, the Springboks maintained dominance, winning 83% of their scrums compared to Scotland's 70%.
The scenario was akin at the lineout, where the Boks secured victory in 91.7% of their lineouts, while Scotland managed a 76% success rate. The Boks also managing to retain 1 of their 2 restart kicks, compared to Scotland’s 0 from 6.
Consequences of the rush defence
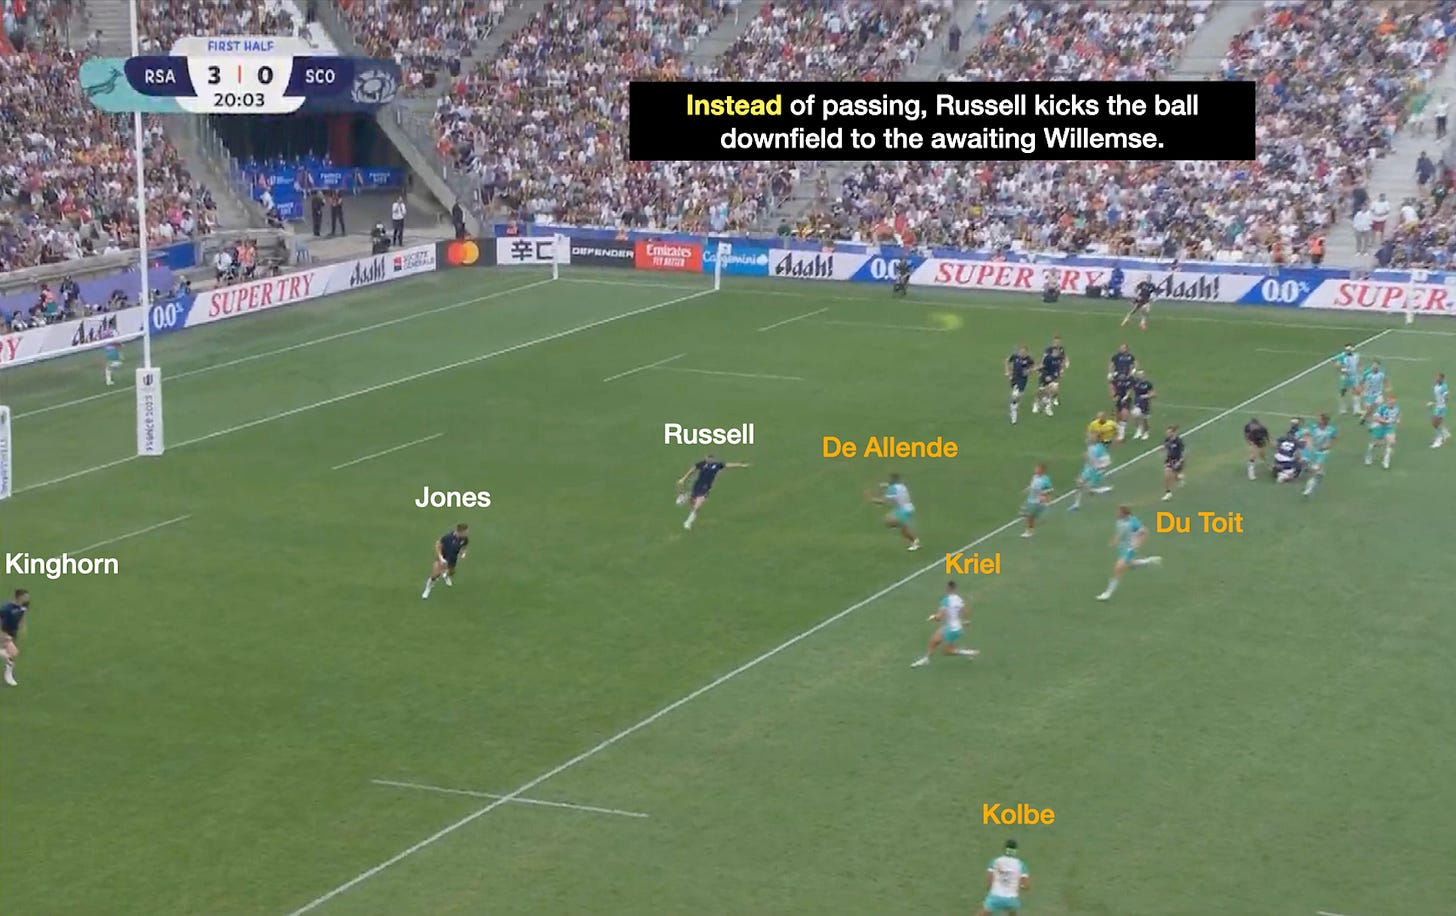
A telling consequence of the Springbok defensive system is that even when teams have a significant overlap, they are hesitant to run the ball from their own half.
In hindsight, despite facing some challenges at scrum time, the Springboks delivered a clinical performance. They capitalised on their opportunities and effectively prevented Scotland from establishing a significant presence in the Springbok half. Nevertheless, as is often the case, there remains ample room for improvement.


